
An impression of pop music
A visual (and short) account of the language of number 1 songs over seven decades

The list of UK Number 1 singles begins on the 14th of November 19521 with Al Martino's ‘Here in my heart’2 and, as I write this, finishes with ‘Flowers’ by Miley Cyrus. The full list is available through the Official Chart site. Given that they are just lists there is not a great deal you can do with them, and they probably tell us more about our own pop memories than anything bigger, yet these charts provide some momentary and small insights into cultural change3. They may be limited and shallow whilst still offering a record and taste of mainstream culture. The tips of the icebergs of musical trends.

From those charts it might be possible to create impressions of cultural change - impressions that might give glimpses of broader things4. One thing they capture, if only in part, is the type of language associated with certain moments. The titles of number one songs give a flavour of the discourse5.
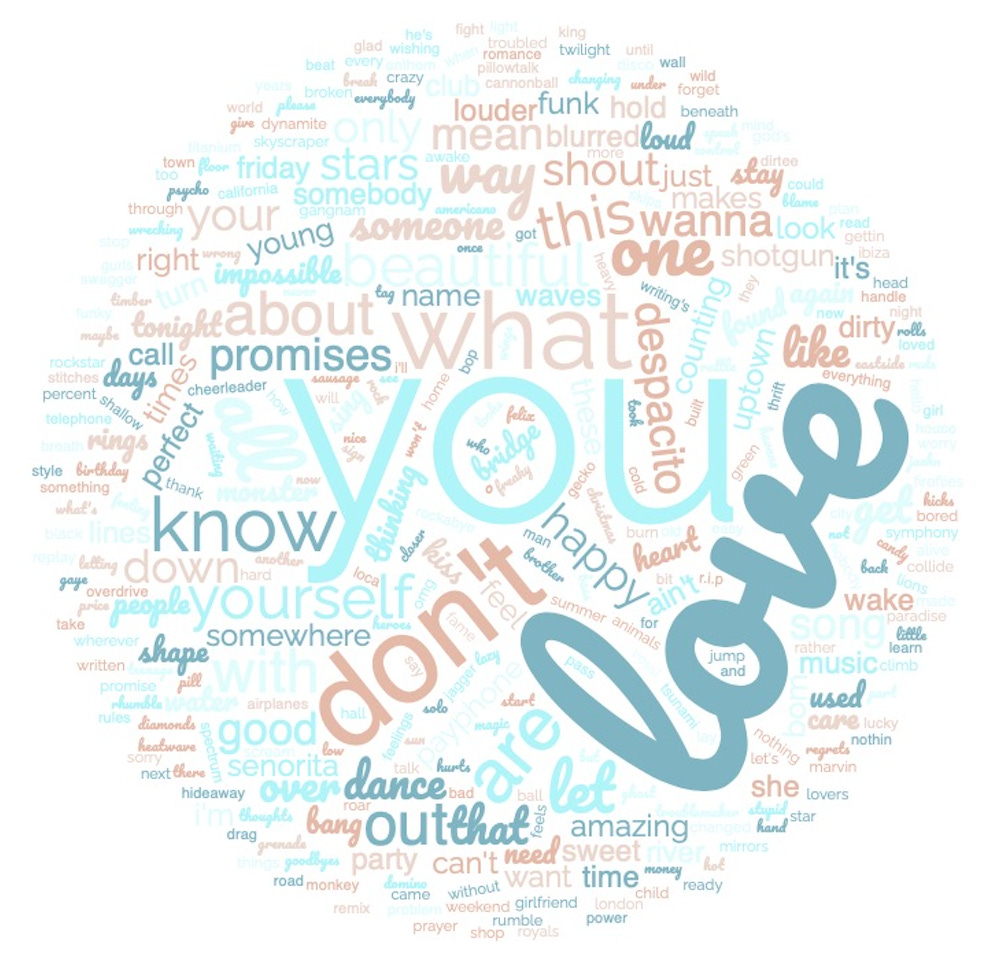
Using the free word cloud generator WordClouds.co.uk I’ve created word clouds of the number 1 song titles for each decade6. These provide an impressionistic overview of the changing words of popular culture over time. We obviously need to be cautious about drawing any strong conclusions from them, they pose questions rather than answers (see the footnotes below for an outline of some of the limitations and questions they create).
Using the official chart list of number ones I entered the titles for the chosen decade into the generator7. In each case I then excluded the word ‘the’ from the cloud8. I only entered the song title once, so a song that was at number 1 for more than one week is only entered into the word cloud a single time9. The only variation on this are the fairly rare occasions where a song has dropped down the chart and then returned to number 1, in which case it was entered more than once in the list10.
Obviously song titles don’t necessarily tell us much about the times, but they are artefacts of a sort. Treated critically, they might still give a feel for the norms, sentiments, values and trends of different moments.

There are continuities that immediately stand out. You could probably have guessed these without much thought - by its nature pop will sometimes be predictable. The word ‘you’ is consistently amongst the most common words. That reflects the way pop songs are adressed at an identified but interchangeable recipient perhaps. This dominance of ‘you’ persists throughout. As does the prominence of ‘love’ - although this dropped back a little in the 1990s before a serious resurgence in the 2010s.

It is some of the mid-sized words that give a hint of the shifts that accompany the established continuities. In the 1990s and to a lesser extent in the 2000s the word ‘boom’ stands out as an example. It would be a little too easy to think this might directly reflect some boom times (before the crash of 2008 onwards etc). Though we should recall the recession of the early 1990s too. Perhaps there are simply small trends - popular phrases and such - in which particular words get used a few times in pop music before disappearing again.

In the 1950s the music itself is a reference point - possibly pointing to pop music discovering itself as a new art form. Words like ‘blues', ‘rock’ and ‘singing’ are more prominent there.

The ‘something’ of the 1960s appears to become ‘everything’ in the 1970s (there is a marginal appearance of ‘nothing’ by the 1990s). And then ‘never’ pops up in 90s and 2000s. In the 2000s and 2010s ‘don’t’ also takes on a larger presence.

The word ‘this’ springs up more in the 2000s, suggesting more of a focus on an object perhaps. Whereas the question of ‘what’ appears very definitely in the 2010s. It's hard to conclude it was anything other than a decade of uncertainty after all.
Word clouds like these can, of course, misrepresent things11. They give an impression, and only that. Seeing pop music in these clouds is more a way of imagining all of that culture and envisioning those many trends together rather than seeing them in a solid, reliable or analytic form. Yet these clouds suggest little glimpses of things. As insights, if we can call them that, the consistencies and repetitions indicated in this method of visualisation are perhaps more pertinent than the small variations12. Maybe it is the similarity of these clouds over the entire history of UK pop music that is the thing that stands out here.
If you happen to be looking for some new music (or nearly new, as I explain in the piece), I’ve written about THUMPER for the music site Louder Than War…

I’ve focused narrowly on the UK here as that was the chart information that was readily available to me. It also made this brief analysis more manageable.
Martino's song spent 9 weeks at number 1. It was the only number 1 of 1952.
Using the number of number ones per year along with the rise in debut number ones, I wrote about what these charts reveal about cultural acceleration in my book The Quirks of Digital Culture.
I provide only brief reflections so the reader can decide what to make of the visuals I’ve created.
The full song lyrics would undoubtedly give a stronger impression.
After an initial burst of enthusiasm about 15 years ago, the word cloud seems to have become relatively neglected as a form of visual analysis. Using it here feels quite old fashioned somehow - maybe even vintage or retro. Also, it has its problems as a visual form of analysis, so what I'm saying here is only provisional and impressionistic.
I didn’t include the 2020s as there isn’t yet enough content to create a word cloud that isn’t skewed too much by the lack of songs. I tried it, but it didn’t really work, with two or three very large words (including Christmas, largely as a result of the 1980s Wham track Last Christmas going to number 1 on three separate occasions already in 2020s).
It always came out as the largest term and obscured the substantive words.
I realise here that a better way of capturing the prominent terms might have been to add multiple entries for a song to reflect the number of weeks it was at number one (and therefore its cultural presence in that year and decade).
The number of number ones in a given year (and decade) has escalated over time. There are a greater number of words entered into the later year clouds. This impacts on the form of these wordclouds. The size of the font can’t really be directly compared between years as the size of a word is relative to the text within an individual word cloud.
As well as the problems raised in the footnotes above and in note 10 below, splitting these clouds by decades is also going to draw lines where none really exist.
These are small pockets of data, so small incidents can look larger than they actually are. We’d have to be careful reading too much into the smaller words as they may have only appeared a small number of times.